


Statistics for Ecologists Using R and Excel
€44,41
- Inclusief 9% btw: €44,41
- Exclusief btw: €40,74
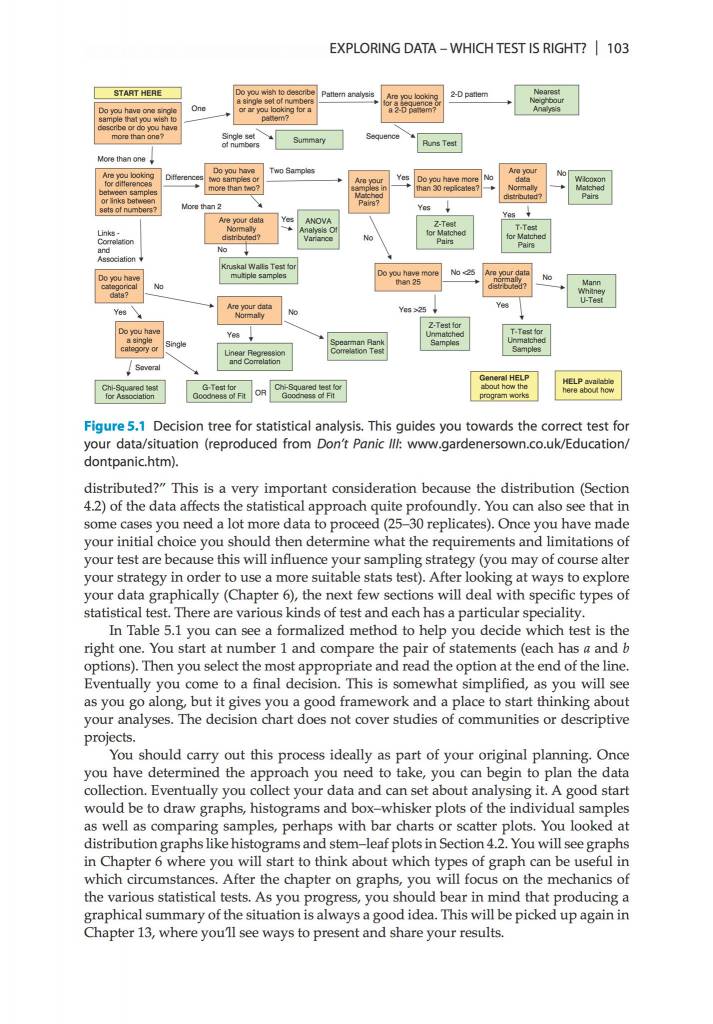
This is a book about the scientific process and how you apply it to data in ecology. You will learn how to plan for data collection, how to assemble data, how to analyze data and finally how to present the results.... Toon meer
- Gratis verzending in Nederland vanaf €50,-*
- Op werkdagen voor 17:00 uur besteld? Zelfde dag verzonden!
- Niet goed? Geld terug
- We denken graag met u mee!