


Statistics for Ecologists Using R and Excel
€44,41
- Including 9% Tax: €44,41
- Excluding VAT: €40,74
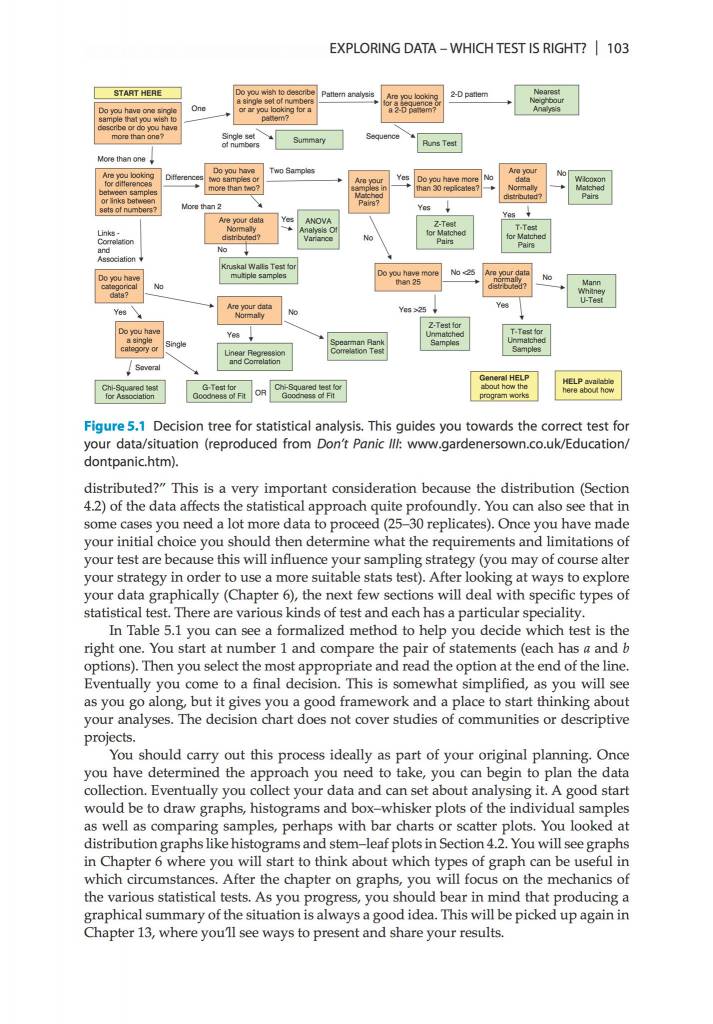
This is a book about the scientific process and how you apply it to data in ecology. You will learn how to plan for data collection, how to assemble data, how to analyze data and finally how to present the results.... Show more
- Gratis verzending in Nederland vanaf €50,-*
- Ordered before 5 p.m. on working days? Shipped the same day!
- 14-day money back guarantee
- We are happy to think along!